Table of contents
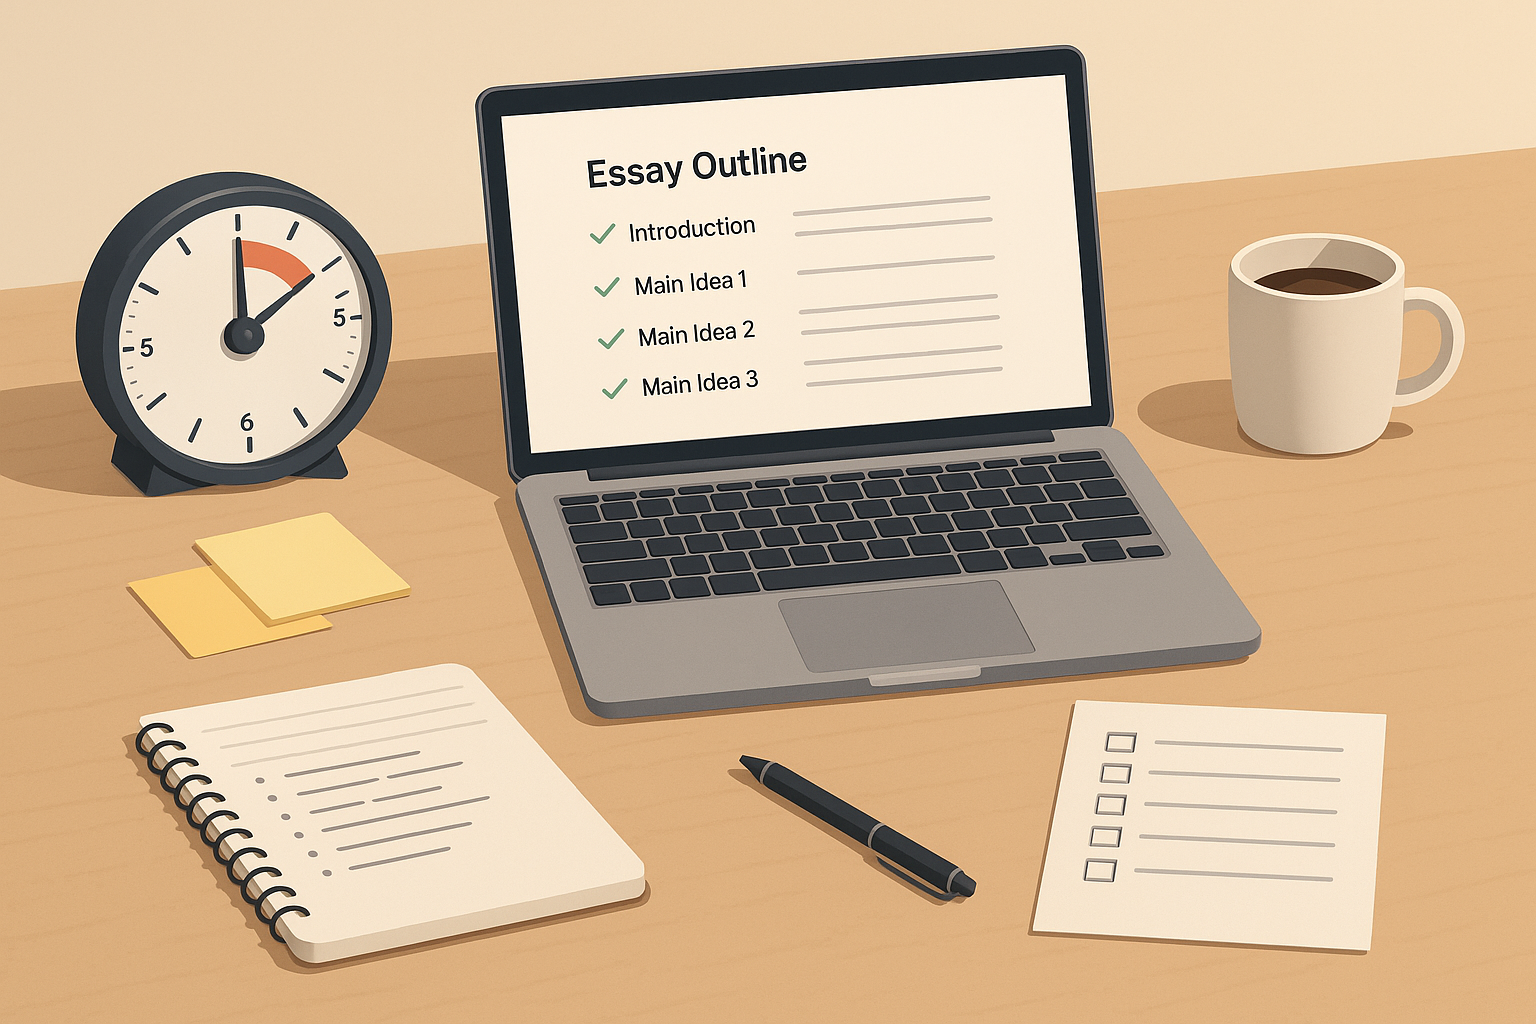
A lab report you can draft tonight focuses on three things: a clear Methods snapshot, clean Results (tables/figures + short captions), and a purposeful Discussion that answers “So what?” Use a time-boxed workflow: outline in 10 minutes, write Methods first, convert data to one tidy table, describe trends, then discuss implications and limits before a fast proofread.
What Your Instructor Expects
Most graders don’t want dramatic prose. They want to see that you ran a sound procedure, recorded data carefully, and interpreted it against the lab’s question or hypothesis. If you’re writing under time pressure, you can still deliver exactly what they look for by aiming at five proof-points:
Clarity of purpose. Signal the experiment’s question and expected relationship in one plain sentence near the start of Methods or the top of Results. You don’t need a full formal Introduction when you’re short on time; a crisp purpose statement often suffices: “We measured how enzyme activity changes with temperature; we expected activity to increase to an optimum then decline.”
Replicable procedure. Methods must be specific enough that a peer could repeat your work: equipment, quantities, conditions, timings, and any controls. Your goal is not to narrate every motion but to report parameters.
Reliable data display. Raw numbers buried in text slow readers. One tidy table (or a small figure) reveals patterns at a glance. Label units, include sample size, and note uncertainty if you have it (e.g., ± SD).
Trend-focused Results. Describe what the data show before you interpret why. Use neutral verbs: increased, decreased, plateaued, peaked, no change.
Purposeful Discussion. Connect trends to the underlying concepts, explain deviations, acknowledge limitations, and close with one actionable next step.
When you meet those proof-points in a short, organized document, you satisfy grading rubrics even if you’re drafting late in the evening.
A Tonight-Only Workflow: Methods, Results, Discussion
The fastest route is counterintuitive: write Methods first, then Results, then Discussion. You’ll avoid procrastinating on interpretation and prevent wasted time hunting for missing details. Here’s how to execute the workflow in a single sitting.
Methods: 25–35 Minutes
Step 1 — Define scope in one sentence.
Open Methods with a clear purpose line that names the variable(s) you changed and measured: “We tested the effect of 0%, 1%, 3%, and 5% salt on seed germination over 72 hours.” That single line anchors the rest of your section.
Step 2 — Report materials and subjects/specimens.
Name relevant equipment and models only if they affect precision (e.g., spectrophotometer model, scale resolution). If materials are standard (beakers, pipettes), list only unusual or calibrated items or those central to the procedure (e.g., “pH meter, resolution 0.01”).
Step 3 — Describe procedure with parameters, not stories.
Write in the past tense and active or passive voice consistently (your course may prefer one, but clarity matters most). Structure the procedure as short paragraphs grouped by stage: preparation, treatment, measurement. Include:
Quantities/Concentrations: “10 mL of 1.0 M HCl” beats “some acid.”
Timings/Temperatures: “Incubated at 37 °C for 20 min.”
Replicates and Controls: “n = 3 per condition; blank control with buffer only.”
Randomization/Counterbalancing (if used): brief but explicit.
Data recording method: “Absorbance at 600 nm recorded every 5 min.”
Don’t explain why here; save rationale for Discussion. Methods is your recipe card.
Step 4 — Quality checks.
Add any calibration steps, error sources you controlled, and software you used for analysis (e.g., spreadsheet, linear fit). If you transformed data (log, normalization), specify it at the end of Methods so the Results read smoothly.
Results: 30–40 Minutes
Your mission: display data cleanly and describe what the reader can see without drifting into interpretation.
Create one tidy table. Put conditions down the rows and the measured outcome across columns, including a summary statistic (mean) and a variability measure if available (SD or standard error). Provide units in headers, include sample size, and add a brief title so the table stands on its own.
Write a narrative that mirrors the table. Start with the overall pattern, then specific highlights, then exceptions. Use numbers sparingly but precisely: “Activity peaked at 45 °C (0.92 ± 0.07 AU, n = 3) and declined sharply at 60 °C (0.21 ± 0.04 AU).”
Avoid causal language. Keep verbs neutral until Discussion. Sentences like “As salt concentration increased, germination decreased from 92% to 38%” are perfect for Results.
Label any figure like a pro. If you add a simple line graph or bar chart, the axis labels and units must match the table. Include a concise caption: “Figure 1. Mean germination (%) after 72 h across NaCl treatments; error bars = SD; n = 3.”
A quick note on stats. If your lab includes a test (t-test, ANOVA), report the statistic and p-value briefly. Keep calculation details out of the main text unless required; they can live in an appendix or your lab notebook.
Discussion: 40–50 Minutes
This is where you answer the “So what?” Use a four-move structure that works across disciplines.
Move 1 — Restate the main pattern in one sentence.
Example: “Enzyme activity increased with temperature up to 45 °C, then declined, indicating an optimal range consistent with temperature-dependent protein stability.”
Move 2 — Connect to theory or mechanism.
Explain why the pattern makes sense. Keep jargon minimal; one or two well-chosen terms show mastery without bloating the paragraph. For biology, connect to enzyme denaturation or membrane fluidity; for physics, to conservation principles or instrument limitations; for chemistry, to reaction kinetics or equilibrium.
Move 3 — Address anomalies and limitations.
If 25 °C looked unexpectedly high, offer two to three plausible reasons grounded in method (calibration drift, incomplete mixing, ambient temperature fluctuation). Make clear whether the issue threatens the main conclusion or only the precision of one point.
Move 4 — Propose a succinct next step.
End with an improvement or follow-up that’s feasible: tightening temperature control to ±0.5 °C, adding a 50 °C treatment to resolve the decline region, increasing replicates from 3 to 5 to narrow uncertainty, or testing a wider salt range (0–8%).
Time-Boxed Plan to Stay on Track Tonight
If you’re starting after dinner, a two-hour sprint is still realistic. Here’s a practical schedule:
00:00–00:10 Outline sections and paste in headers.
00:10–00:40 Draft Methods from your notebook; fill in numbers while they’re fresh.
00:40–01:10 Build one table and a figure if required; write Results paragraphs.
01:10–01:40 Write Discussion using the four moves above.
01:40–02:00 Format, proofread, and export.
Polishing and Formatting in Under 30 Minutes
Presentation earns easy points. A short polish makes your report feel complete even when time is tight.
Formatting Essentials That Save Marks
Consistent tense and voice. Methods in past tense; Results often past; Discussion can mix past (what you found) with present (what it means). Choose active or passive and stick to it.
Units and significant figures. Match precision to your instrument. If your thermometer reads to 0.1 °C, report 37.0 °C, not 37 °C. Keep sig figs consistent across table and text.
Captions and titles. Your table and figure should be understandable without reading the body. Include what was measured, where, and how variability is shown.
Abbreviations. Define on first use and then keep them consistent. If you use “OD600,” define it once: optical density at 600 nm (OD600).
Referencing sections. In Results, point readers to the display: “(see Table 1)”. In Discussion, cite the observed peak or threshold precisely: “peak at 45 °C (Table 1)”.
Quick, High-Impact Proofreading Pass
Set a 10-minute timer and do one high-leverage sweep:
Numbers: Are all units present? Do totals match? Are decimal places consistent?
Labels: Does every table/figure have a title and caption with units and n?
Logic: In Results, did you avoid explaining why? In Discussion, did you avoid repeating every number?
Style: Short sentences, active verbs, no filler. Replace “It is important to note that” with the claim itself.
Image Ideas (with alt text you can paste later)
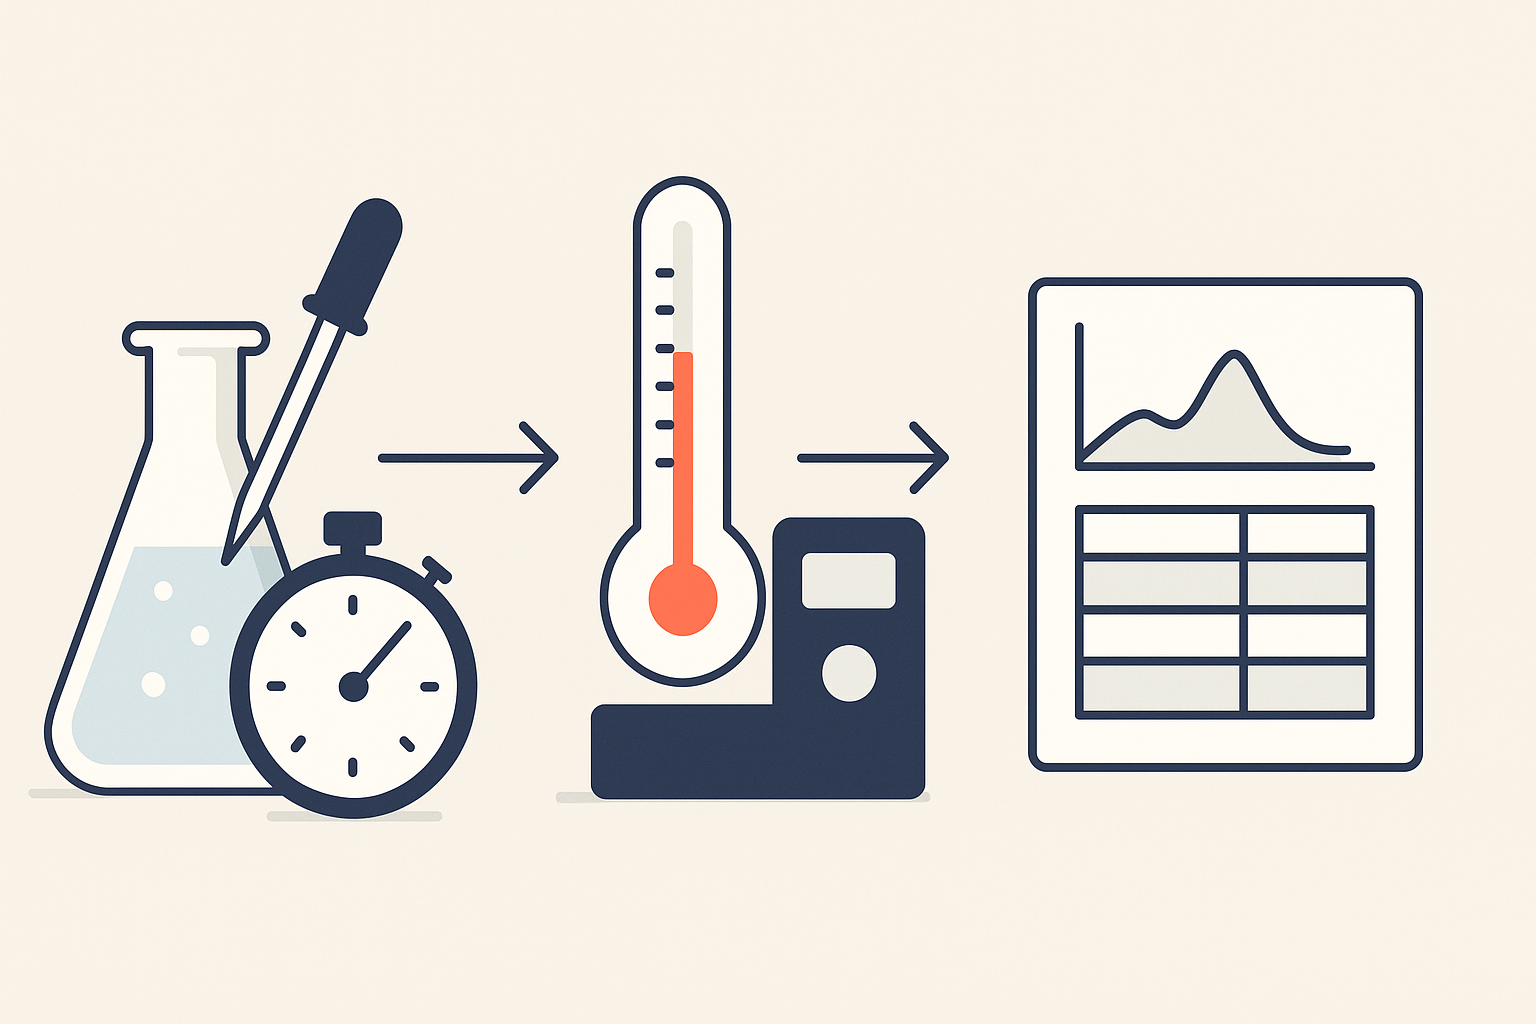
Image 1: A minimal flow diagram of the lab workflow from setup → treatment → measurement → analysis.
Alt: “Simple lab report workflow showing setup, treatment, measurement, and analysis steps.”Image 2: A clean line graph illustrating a generic “increase to optimum then decline” trend.
Alt: “Line graph with a peak at mid-range temperature and decline at high temperature.”
Examples, Templates, and a Mini-Case
This section gives you plug-and-play language, a comparative table you can adapt, and a mini-case showing how the pieces fit when you’re racing the clock.
Ready-to-Adapt Sentences
Methods (pick and tailor):
“Samples (n = 3 per condition) were incubated at [temperature] °C for [duration] minutes, then measured at [wavelength/scale].”
“Solutions were prepared at [concentration] using [solvent/buffer]; pH was adjusted to [value] with [reagent].”
“Measurements were recorded every [interval] using [instrument, model] (resolution [value]).”
Results:
“Response increased from [low] to [mid], peaking at [value] before declining at [high].”
“Treatment [B] showed no statistically significant difference from control (p = [value]).”
“Variability was lowest at [condition] (SD = [value]), suggesting improved stability.”
Discussion:
“The observed peak aligns with [theory/mechanism], where [brief explanation].”
“Anomalies at [condition] may reflect [source of error]; however, the overall trend remains consistent.”
“Future work should [improvement] to refine estimates around the optimum.”
One-Table Display You Can Reuse
Table 1. Example results for an enzyme activity lab across temperatures (mean ± SD; n = 3).
| Temperature (°C) | Activity (AU)* | Notes |
|---|---|---|
| 20 | 0.31 ± 0.05 | Low baseline activity |
| 30 | 0.58 ± 0.06 | Rising trend |
| 37 | 0.79 ± 0.05 | Near-optimal |
| 45 | 0.92 ± 0.07 | Peak |
| 60 | 0.21 ± 0.04 | Sharp decline |
AU, arbitrary units normalized to blank.
You can replace temperature and activity with your own variable pair (e.g., salt % and germination rate). Keep the structure—ordered condition, summary statistic, short note—and your grader will read the pattern instantly.
Good vs. Weak Sentences (Quick Comparison)
Use this as a micro-rubric while writing.
| Section | Good (concise and informative) | Weak (vague or interpretive in the wrong place) |
|---|---|---|
| Methods | “We incubated 10 mL of 0.5% starch at 37 °C for 20 min (n = 3).” | “We heated the samples for a while until they seemed ready.” |
| Results | “Absorbance increased from 0.31 to 0.92 AU between 20 °C and 45 °C (Table 1).” | “The data were pretty good overall with a big increase.” |
| Discussion | “The decline at 60 °C supports heat-induced denaturation reducing activity.” | “The data went down because something went wrong.” |
Mini-Case: Drafting the Report Before Midnight
Scenario. You completed a photosynthesis lab measuring oxygen production at different light intensities (0, 50, 100, 200 µmol m⁻² s⁻¹) using Elodea sprigs and a dissolved oxygen probe.
Goal. Submit a solid lab report tonight.
Execution.
Methods (25 minutes).
You open with the purpose: “We quantified the effect of light intensity on oxygen production in Elodea over 15 minutes.” You specify the apparatus (probe model and calibration), sample prep (three sprigs per beaker, 200 mL water, 20 °C bath), intensities (0/50/100/200), timing (5-min dark acclimation; 15-min measurement), and replicates (n = 3 per intensity). You note that oxygen was recorded every minute and later averaged; the probe was calibrated in air-saturated water.
Results (30 minutes).
You convert your notebook into one table: intensity vs mean ΔO₂ (mg L⁻¹ min⁻¹) ± SD, plus a short note column. Your short narrative starts with the broad pattern: oxygen production increased with light up to 100 and plateaued by 200. You add one sentence about variability being higher at 0 because changes were near the sensor’s detection limit. If you have time, you add a line graph; otherwise, the table stands alone with a crisp caption.
Discussion (40 minutes).
You restate the key finding: rising production with light intensity until saturation. You connect it to photosynthetic light response curves and enzyme/light capture limits; you suggest that at 200 the apparatus or leaf area limited further increase. You explain one outlier at 50 (air bubble on the probe) and recommend two improvements: pre-rinsing probes between runs and extending the intensity range to 300 for a clearer saturation curve. You end with a practical next step—estimating the point of diminishing returns via a hyperbolic fit next time.
Polish (15 minutes).
You ensure units are present, sig figs match the probe resolution, and the caption names error bars. The report exports cleanly with correct margins and page numbers.
A One-Sitting Checklist (use it sparingly)
Fill in the purpose line, materials that affect precision, and stepwise parameters (quantities, times, temps, n).
Build one table with units and n; write a Results paragraph describing trends without interpretation.
(Tip: This checklist plus the Table of Contents are the only lists you need. Keep the rest as short paragraphs.)
Final Touches That Make a Fast Report Look Professional
Even when you’re racing a deadline, a few stylistic habits elevate your work.
Front-load meaning. Start paragraphs with the main claim: “Activity peaked at 45 °C.” Supporting numbers follow. This mirrors how graders skim.
Short, concrete sentences. Favor punchy lines over compound sentences. If a sentence has more than 22 words, check if a cut improves clarity.
Parallel structure. In Methods, write parallel steps—same tense, similar phrasing—so readers grasp the flow instantly.
Data-ink ratio. In tables or figures, remove nonessential gridlines, keep labels horizontal, and limit to two decimals unless precision demands more.
Ethics and integrity. If a trial failed, you can exclude it with justification (documented instrument failure), but never “massage” numbers. A clear note in Methods about excluding a run is better than suspiciously perfect data.
Submission hygiene. Name your file descriptively: Lastname_Course_LabX_Report. Include your name, date, lab partner(s), and instructor if required. Export to PDF to preserve layout unless your course asks for an editable format.
Template You Can Paste and Fill Tonight
(Replace bracketed text and keep within your course’s formatting rules.)
Title: [Variable A] and [Variable B]: Effects on [Outcome]
Author: [Name], [Course], [Date]
Methods
We investigated [purpose statement]. Samples (n = [3/5]) of [organism/material] were prepared with [key reagents/equipment; model/resolution if relevant]. Treatments were [levels or conditions]. Each trial ran [duration] at [temperature or environment]. Measurements were recorded [frequency] using [instrument/software]. Data were [averaged/normalized/transformed] prior to analysis.
Results
[Outcome] increased/decreased across treatments, peaking/plateauing at [condition] (Table 1). Variability was [low/moderate/high] at [condition] (SD = [ ]). No change was observed between [conditions]. If stats applied: [test] indicated [result, p = ].
Table 1. [Your table title: variable levels vs outcome (units), mean ± SD; n = ].
Discussion
The main trend shows [summary of pattern], consistent with [concept/mechanism]. The decline at [condition] likely reflects [explanation]. Anomalies at [condition] may stem from [error/limitation]; they do not alter the central conclusion. Next steps include [improvement or extension] to refine the estimate near [threshold/optimum].
Conclusion
In [one sentence], restate the finding and its implication for the lab objective.
Why This Approach Works When You’re Out of Time
When you’re drafting late, the temptation is to start with a long Introduction and get stuck. This guide flips the script. By starting with Methods, you anchor all later claims in concrete parameters; by crafting Results around a single tidy table, you make trends visible; and by structuring Discussion with four moves, you transform scattered thoughts into a purposeful, graded-ready explanation. The discipline of neutral verbs in Results and theory-linked reasoning in Discussion prevents the most common rubric deductions. Add a 15-minute polish—units, captions, consistent tense—and your lab report reads as deliberate, not last-minute, even if you built it tonight.
It is easy to check materials for uniqueness using our high-quality anti-plagiarism service.
Order now »